Beyond the Click Rate: Simulation Metrics That Matter
Click rate alone is a weak signal. The simulation metrics that predict real resilience — report rate, time-to-report, miss rate — with honest benchmarks.
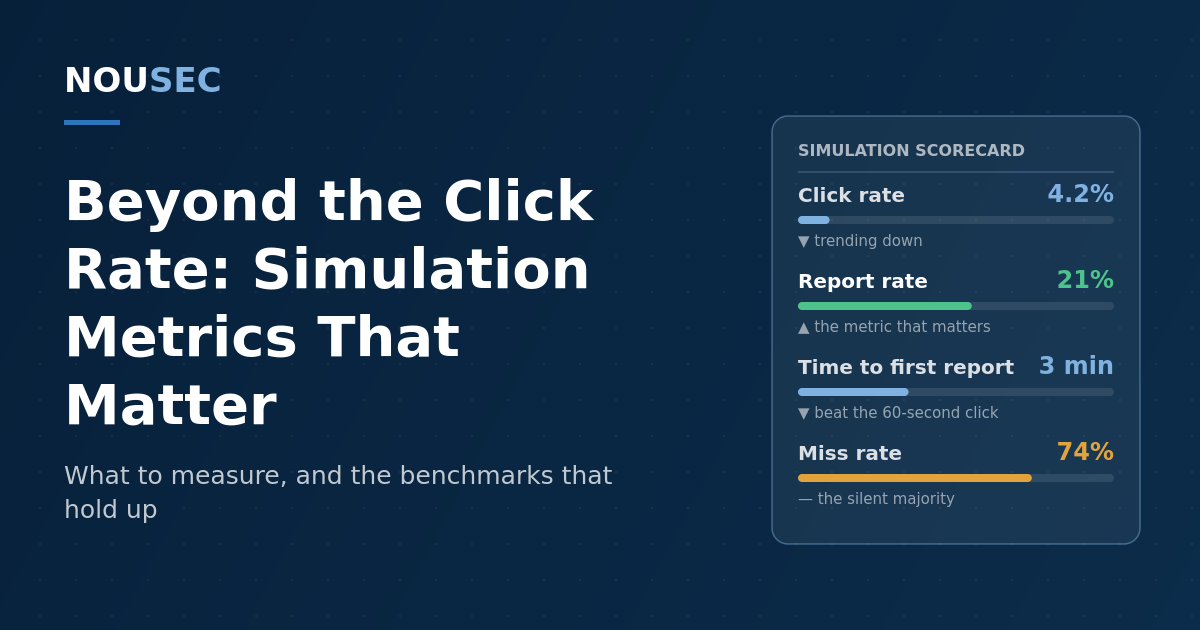
Ask a security team how their phishing simulation program is going and you will almost always get one number back: the click rate. It is the number in the board deck, the number the vendor dashboard puts front and center, and the number that decides whether the program is judged a success. It is also the least informative metric the program produces — and by itself, it can be actively misleading.
The human layer is where most breaches still start — the Verizon DBIR puts the human element in 62% of breaches — so measuring it well matters. This analysis covers what click rate actually measures, the metrics that predict real-world resilience, the honest benchmark ranges for each, and how to combine them into a measurement model your leadership can trust. If you are designing the program itself — cadence, template rotation, no-blame rules — start with our phishing simulation best practices guide; this piece is about how to score it.
Click rate measures the lure as much as the person
A click rate is a compound of three things: how susceptible your people are, how hard the template was, and who happened to be in the send. Change any one and the number moves — which is why a falling click rate does not automatically mean rising resilience.
The research is blunt about this. In an eight-month study of around 19,500 employees at UCSD Health, Ho et al. (IEEE S&P 2025) found no significant relationship between having recently completed annual awareness training and the probability of failing a simulated phish; embedded training moved failure rates by about two percentage points, and 75% of employees spent a minute or less on the training pages. If your click rate improved last quarter, the cause may be your training — or it may be an easier template mix, a lucky send window, or employees warning each other in chat.
There is also a speed problem that click rate hides entirely. The 2024 edition of the Verizon DBIR measured a median of 21 seconds from opening a phishing email to clicking the link, and roughly another 28 seconds to enter data — under a minute from open to compromise. A metric that only counts victims after the fact tells you nothing about whether anyone raised the alarm inside that minute.
None of this makes click rate useless. It is a fine trend line when template difficulty is held honest (more on that below). But it cannot carry a program on its own.
Click rate measures the lure. Report rate measures the organization.
The metrics that predict resilience
The metrics worth putting in front of leadership share one property: they measure what your organization does about a phish, not just who fell for it.
| Metric | What it tells you | Working benchmark |
|---|---|---|
| Baseline click rate (untrained) | Your true starting exposure | ~33% (KnowBe4 2026 benchmark) |
| Click/failure rate, mature program | Whether training is holding | 4.2% at 12 months (KnowBe4); 2–10% (Hoxhunt) |
| Report rate | Whether people act, not just abstain | 20% median without clicking (DBIR 2024); >20% sustained = real behavior change (Hoxhunt) |
| Report-after-click rate | Whether clickers self-report — your recovery window | 11% median (DBIR 2024) — push it far higher |
| Time-to-first-report | Whether detection beats the attacker's ~60-second window | Minutes, not hours; trend it downward |
| Miss rate | Share who neither clicked nor reported — the silent majority | Shrink it; it is where the next incident hides |
| Repeat-failure concentration | Whether risk is broad or pooled in a few people/teams | Small, identified, supported — not punished |
Three of these deserve emphasis.
Report rate is the single best program-level metric. In Verizon's simulation data, 20% of users reported the phish without clicking it — and only 11% of those who clicked went on to report what they had done. That second number is the one that should worry you: it means roughly nine out of ten compromises started with the victim staying silent. Every point of improvement there directly shortens real incident response, which is why reporting behavior is the backbone of incident response for social-engineering attacks.
Time-to-first-report turns reporting from a compliance statistic into a detection capability. If your first report reliably lands within a few minutes of a campaign hitting inboxes, your security team can pull the message fleet-wide and revoke exposed sessions while the attacker is still working. Track the median and the trend, per campaign.
Miss rate — the share of recipients who neither failed nor reported — is the most ignored number in most dashboards. A 5% click rate with a 15% report rate means 80% of your organization saw a suspicious email and did nothing. That silent majority is not safe; it is unmeasured.
Benchmarks are a starting line, not a scoreboard
Cross-vendor benchmarks are useful for one thing: telling you whether your program is roughly where peers are. KnowBe4's 2026 Phishing by Industry benchmark — 42 million simulated emails across 14.8 million users — puts the untrained baseline at 33.2%, falling to 20.1% after ninety days and 4.2% after a year of combined simulation and training. Hoxhunt's Phishing Trends Report, from a dataset of around 50 million simulation events, bands failure rates at 25–35% with no training, 10–20% for early-stage programs, 5–10% for mature ones and 2–5% for behavior-focused programs, with sustained reporting above 20% as the clearest marker of genuine change.
Two caveats before you paste those into a slide. First, vendor benchmarks average across wildly different template difficulty, industries and cadences — your 6% and a peer's 6% may not describe the same behavior. Second, benchmarks describe other organizations' averages, not your risk. The NIST Phish Scale exists precisely because a click rate is uninterpretable without a difficulty rating: it scores each template on observable cues and premise alignment so you can say "8% on a hard template" and mean something. Rate every template you send, and report click rates alongside difficulty — never as a single blended number.
One more reason to trust trends over snapshots: the skill you are measuring decays. Reinheimer et al. (SOUPS 2020) found phishing-detection ability jumped immediately after training (d′ from 1.11 to 2.13), was still measurable at four months, and was statistically gone by six. A quarterly snapshot taken right after training and one taken five months later are measuring two different organizations.
How to build a measurement model that holds up
1. Fix the metric set before the next campaign. Pick five numbers — click rate by difficulty band, report rate, report-after-click rate, median time-to-first-report, miss rate — and commit to reporting all of them every cycle, including the quarters that look bad. A model you only publish when it flatters you is marketing.
2. Rate template difficulty, then weight the results. Use the Phish Scale (or an equivalent rubric) on every template before sending. Report results within difficulty bands, and treat a stable click rate on rising difficulty as the success it is.
3. Segment by exposure, not just department. Finance approvers, help-desk staff, executive assistants and admins with privileged access face different attacker attention than the average mailbox. Benchmark those groups against themselves over time; a 3% click rate in a group that can move money is worth more attention than 8% elsewhere.
4. Track individuals longitudinally — into a risk score. A person's trajectory across ten campaigns, weighted by difficulty and combined with reporting behavior and real-world signals, is a far better risk estimate than any single result. That is the logic of a human risk score: simulation outcomes become one input among several, and interventions get targeted at the small population carrying most of the risk. Our guide to quantifying employee security risk covers the scoring mechanics.
5. Report trends and decisions, not tables. Leadership needs three lines — failure trend by difficulty, report rate trend, time-to-report trend — plus the decision each one drives: where the next training cycle focuses, which groups get phishing-resistant MFA first, what the ROI case for the program looks like against those numbers.
The measurement mistakes that poison the data
A few practices reliably corrupt the very metrics you are trying to read. Punishing clicks is the worst: it suppresses reporting, which destroys your best metric to save your vanity one. Averaging results across difficulty levels hides both your wins and your exposure. Announcing campaign windows teaches people to be suspicious for a week per quarter. And testing only desktop email measures the easy half of the problem while attackers move to SMS, QR codes and voice — if a channel can carry a lure, it belongs in the simulation program and in the numbers.
Measured this way, a simulation program stops being a quarterly ritual that produces a percentage and becomes what it should have been all along: a continuously calibrated sensor for the human layer of your attack surface — one that tells you not just who might click, but whether your organization would catch the campaign that matters.
Frequently asked questions
What is a good phishing simulation click rate?
Untrained organizations typically start around 33% on baseline tests according to KnowBe4's 2026 industry benchmark, falling to roughly 4% after twelve months of combined training and simulation. Hoxhunt's dataset puts mature programs at 5–10% and highly mature, behavior-focused programs at 2–5%. But a raw click rate is only meaningful relative to template difficulty — a 12% click rate on a hard, well-targeted template is a better result than 4% on an obvious one.
What is a good phishing report rate?
In Verizon's 2024 DBIR simulation data, 20% of users reported the phish without clicking — treat that as the median you need to beat. Programs that sustain reporting above 20% of simulations are showing genuine behavior change; the strongest programs push well past that. Just as important is the trend: a report rate that rises quarter over quarter while time-to-first-report falls is the clearest evidence a program is working.
Why does time-to-report matter more than the number of reports?
Because real campaigns are decided in minutes. Verizon's 2024 DBIR measured a median of 21 seconds to click a phishing link after opening the email, and about 60 seconds total until data is entered. A report that arrives within a few minutes of delivery lets the security team pull the email from other inboxes and revoke sessions before most of the damage is done. A report that arrives the next morning is forensics, not defense.
Should simulation results feed into an individual risk score?
Yes, with care. A single click is noise; a pattern of clicks across campaigns, weighted by template difficulty and combined with real-world signals like credential hygiene and reporting behavior, is a usable risk signal. Score trends and groups rather than shaming individuals, keep the data access-controlled, and use scores to target support — extra coaching, hardware keys, tighter approval flows — not punishment.
NOUSEC simulates attacks across 8 channels and turns the results into one number your board can read.
Book a demo