What Your Click Rate Can't Tell You
Click rates measure activity, not belief. How to measure security culture with surveys, behavior data, and operational signals a board will trust.
Your awareness dashboard is green. Training completion is at 97%, the simulated click rate fell again last quarter, and the compliance audit sailed through. And yet in Proofpoint's 2024 State of the Phish, 71% of employees admitted taking a risky action in the past year — and 96% of them knew it was risky when they did it. The problem those dashboards measure is knowledge. The problem that actually produces breaches is what people choose to do with it, under pressure, when nobody is checking.
That gap has a name: security culture — the shared attitudes, norms, and defaults that decide whether the policy survives contact with a busy Tuesday. With the Verizon DBIR 2026 attributing 62% of breaches to the human element, culture is arguably the control with the largest blast radius in your whole program. It is also the one most teams never measure.
Measuring it is less mysterious than it sounds. Security culture is measured by combining two kinds of evidence: a validated survey that captures beliefs and norms across defined dimensions, and observed behavior — report rates, verification compliance, real incident responses — that shows what people actually do. The signal is strongest where the two disagree.
Activity is not belief
Most "culture" reporting is actually activity reporting. Completion rates measure whether people sat through a module. Click rates measure performance against one attack type, on one channel, in a test. Both are worth tracking — we've written about which simulation metrics mean something — but neither tells you what an employee believes their job is when a real decision arrives.
The size of that blind spot is measurable. In the same Proofpoint study, 85% of surveyed security professionals said employees knew they were responsible for security — but 59% of employees either weren't sure they were responsible or didn't believe they were. Your program can be flawless on paper while half the company believes it is somebody else's problem.
The broader benchmark is not encouraging either. KnowBe4's 2024 Security Culture Report — the largest study of its kind, covering more than 800,000 employees across 4,078 organizations in 18 industries — put the global security culture score at 72 on a 0–100 scale, a level the report classes as "low to moderate." The score was unchanged from the year before. Organizations are spending more on awareness than ever, and the culture needle, measured at scale, is not moving.
A click rate tells you what happened in a test. Culture decides what happens when the test is over, the deadline is real, and the request says it comes from the CFO.
Seven dimensions, two kinds of evidence
You cannot improve a vague thing, so the first step is to make culture concrete. The most widely used decomposition comes from the research group behind KnowBe4's benchmark, which measures seven dimensions of security culture: attitudes, behaviors, cognition, communication, compliance, norms, and responsibilities. ENISA's cybersecurity culture guidelines take a similar view, framing culture as beliefs and values that must be built into working practice rather than bolted on as training.
The dimensions matter less as theory than as a checklist: each one can be probed by a survey question and checked against an observable behavior. That pairing is the whole method.
| Dimension | Survey signal (what people say) | Behavioral signal (what people do) |
|---|---|---|
| Attitudes | "Security controls are worth the friction" | Exception requests per policy; workaround prevalence |
| Behaviors | Self-reported secure habits | Simulation outcomes; password manager adoption |
| Cognition | Understanding of why controls exist | Quality of reported suspicions, not just quantity |
| Communication | "I know where to report and I'd be taken seriously" | Report rate; time-to-report; questions asked before incidents |
| Compliance | Knowledge of the written policy | Callback-verification compliance on payment changes |
| Norms | "People around me follow the rules" | Whether shortcuts survive peer visibility |
| Responsibilities | "Security is part of my job" | Reports and escalations from non-IT teams |
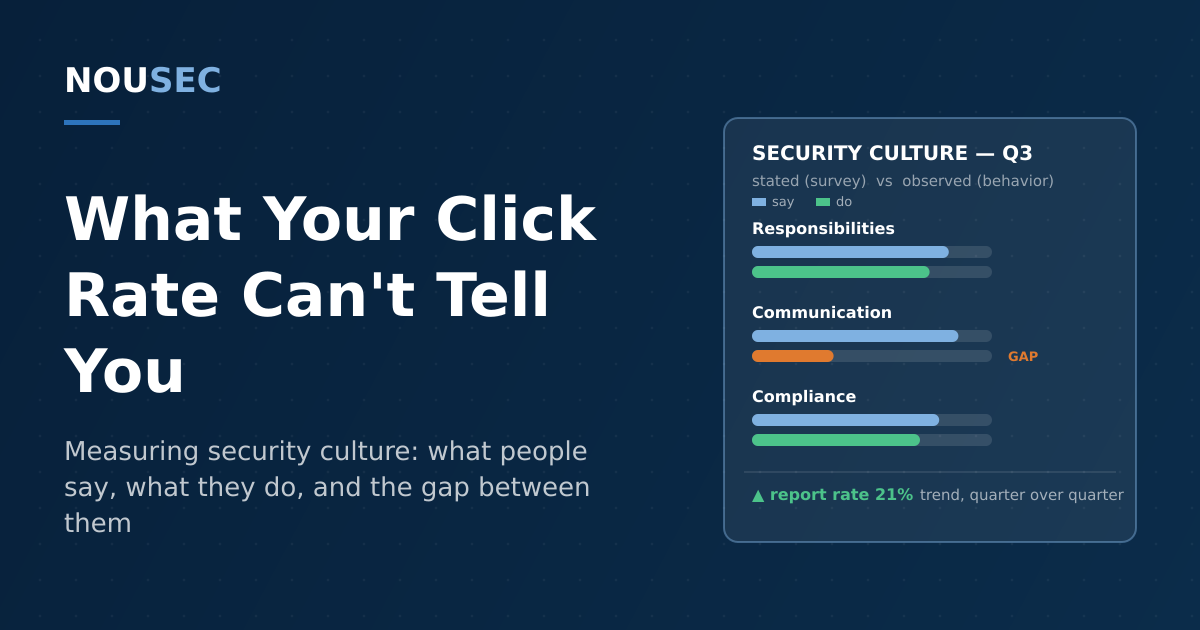
A survey alone can be gamed by optimism; a log file alone can't see a belief. Together they triangulate. If the communication dimension scores high but the actual report rate is flat, people are telling you reporting should be safe — and showing you they don't believe it yet.
The behavioral layer: what people do when it counts
Culture measurement earns its budget when it predicts outcomes, and here the evidence is unusually direct. A 2021 KnowBe4 Research analysis of 97,661 employees across 1,115 organizations compared security culture scores with what employees did on simulated phishing sites: in organizations with a poor culture score, 5.2% of employees entered their credentials; in organizations with a good score, 0.1% did. That is a 52-fold difference in the single behavior — credential entry — that opens the door to most account takeovers.
Three behavioral metrics deserve a permanent place on the culture dashboard:
- Report rate and time-to-report. The clearest cultural signal there is, because reporting is voluntary, slightly costly, and depends entirely on trust. A sustained report rate above 20% of simulations marks behavior-changed organizations in Hoxhunt's benchmark data, against roughly 10% for traditional programs. Rising reports after a click matter most of all — they measure whether people believe reporting a mistake is safe.
- Verification compliance. The share of payment-change requests, password resets, and unusual executive requests that were verified through the defined out-of-band channel. This is culture measured exactly where money is lost, and it makes finance and help-desk teams first-class citizens of the program.
- Non-IT escalations. Who is doing the reporting? A healthy culture produces suspicion reports from sales, HR, and the warehouse, not just from engineers. Concentration of all security behavior in one department is a culture finding, not a staffing one.
None of these require new tooling — they come from systems you already run. What they require is being counted, segmented by team, and watched over time, which is precisely the job of a human risk score: folding survey results and observed behaviors into one trend line per team, so culture stops being an anecdote.
A quarterly program that fits on one page
Measuring culture does not need a research department. It needs a repeatable loop:
- Baseline with a validated survey. Use an instrument that covers the dimensions above, keep it short, and guarantee anonymity — a culture survey people answer defensively measures fear, not culture. Once or at most twice a year.
- Pick three behavioral metrics and freeze them. Report rate, time-to-report, and verification compliance are a strong default. Changing metrics every quarter destroys the trend line, which is the only thing boards actually trust.
- Segment by team, not individual. Culture is a group property. Team-level views find the weak spots without turning measurement into surveillance — and they locate where a security champion would do the most good.
- Compare the two layers. Flag every team where stated beliefs and observed behavior diverge. That delta is your priority list.
- Close the loop visibly. Publish what was found and what changed because of it. A survey that disappears into a void teaches people that feedback is theater — the fastest way to lower next year's response rate and the culture with it.
- Staff it honestly. The SANS 2025 Security Awareness Report found programs need around 2.8 dedicated full-time staff to change behavior and four or more to begin shifting culture; 80% of its 2,700+ respondents ranked social engineering as their top human risk. If culture is on your objectives with 0.5 of a person behind it, the measurement will mostly document that fact.
Keeping the measurement honest
Two failure modes deserve standing guardrails. The first is gaming: any metric tied to blame will be managed instead of improved. If a bad simulation result triggers punishment, click rates will improve and reporting will die — the opposite of culture. Keep consequences out of individual results and celebrate reporting loudly, including reports of real mistakes.
The second is fatigue. Surveys, nudges, and campaigns all draw on the same finite attention; past a point they produce security fatigue rather than engagement. One well-run survey a year, three stable metrics, and visible follow-through beat a monthly questionnaire every time.
Measured this way, culture stops being the soft part of the program and becomes its leading indicator — the number that moves before the incident count does. That is also the argument that wins the budget conversation: completion rates prove you ran training, but a culture trend line proves the organization is becoming harder to deceive.
Frequently asked questions
What is a security culture score?
A security culture score is a numeric summary of how an organization's people think about and act on security, usually built from a validated survey across dimensions such as attitudes, behaviors, cognition, communication, compliance, norms, and responsibilities. KnowBe4's benchmark, which scores on a 0–100 scale, put the global average at 72 — described as low to moderate — across more than 800,000 employees in its 2024 report. A survey-based score is most useful when it is paired with observed behavior, such as phishing report rates, so the stated culture and the lived culture can be compared.
How often should security culture be measured?
Run the full survey once or twice a year — more often produces survey fatigue and noise rather than signal — and track behavioral indicators continuously. Report rates, simulation outcomes, time-to-report, and verification compliance move week by week and show whether the culture is holding between surveys. A practical cadence is an annual or semi-annual survey to measure beliefs and norms, quarterly reviews of behavior trends by team, and a yearly board-level summary that puts both on one page.
Are surveys or behavior data better for measuring culture?
Neither works alone. Surveys reach beliefs, norms, and psychological safety — things no log file records — but people over-report their own diligence, and the gap between answers and actions can be wide: in Proofpoint's 2024 State of the Phish, 85% of security professionals believed employees knew they were responsible for security, while 59% of employees either weren't sure they were responsible or didn't believe they were. Behavior data is honest but narrow. The most informative measurement is the delta between the two: a team that scores itself highly while reporting nothing is telling you exactly where the culture is thinnest.
What is a good phishing report rate?
Benchmarks from Hoxhunt's large simulation dataset suggest a sustained report rate above 20% of simulated attacks is the clearest single sign of real behavior change, while traditional once-a-year programs typically sit near 10%. In the 2024 Verizon DBIR, 20% of users reported simulated phishing without clicking, and only 11% of those who clicked went on to report it. Trend matters more than the absolute number: a report rate that rises quarter over quarter — especially reports after a click — shows growing trust that reporting is safe, which is the cultural outcome that shortens real incidents.
NOUSEC simulates attacks across 8 channels and turns the results into one number your board can read.
Book a demo